Skip to content
+353 21 743 1603 enquiries@siorconsulting.com

Our Project Gallery

TAKE A LOOK

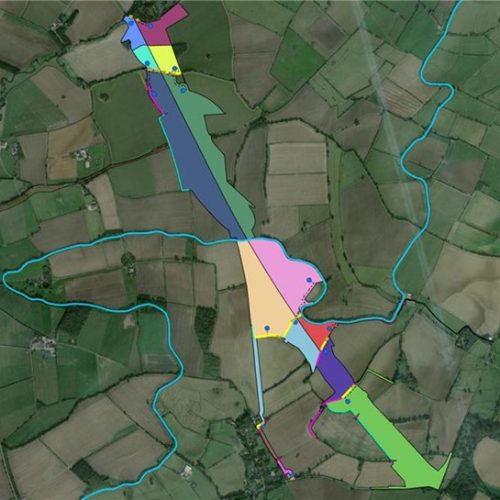
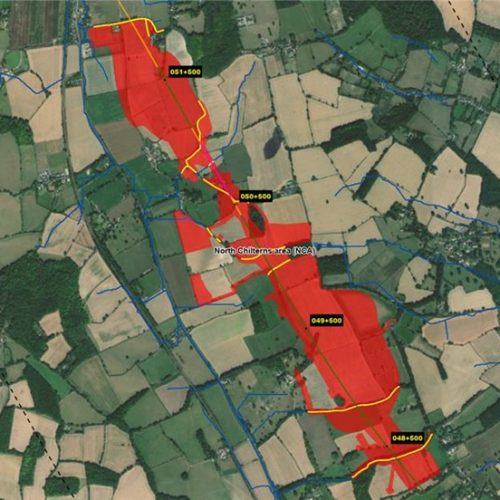
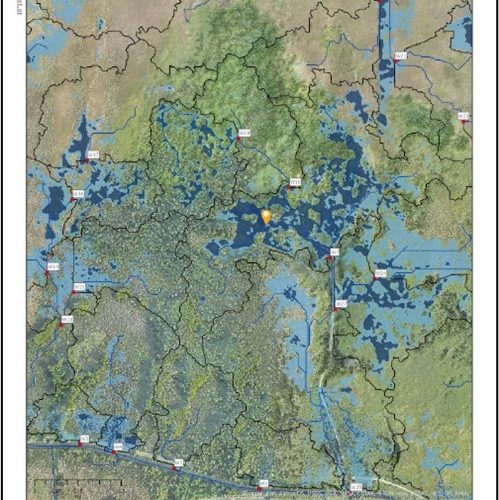
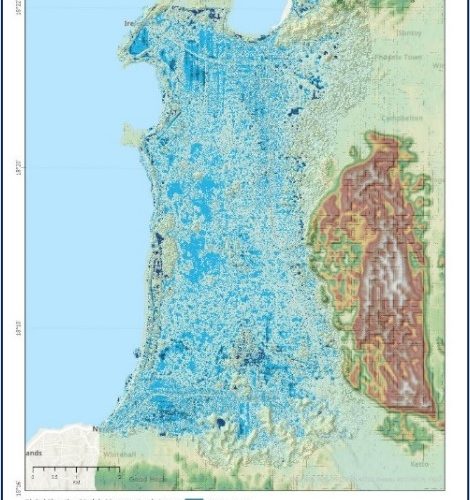
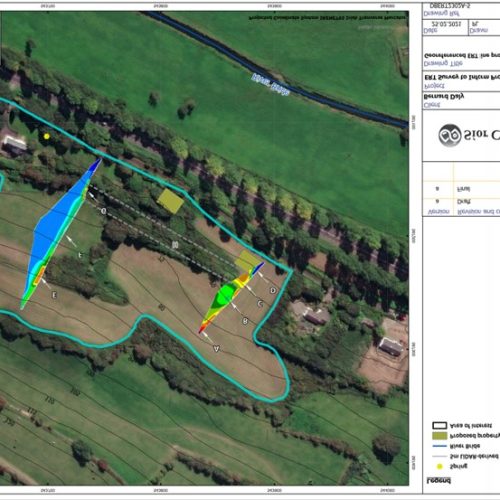
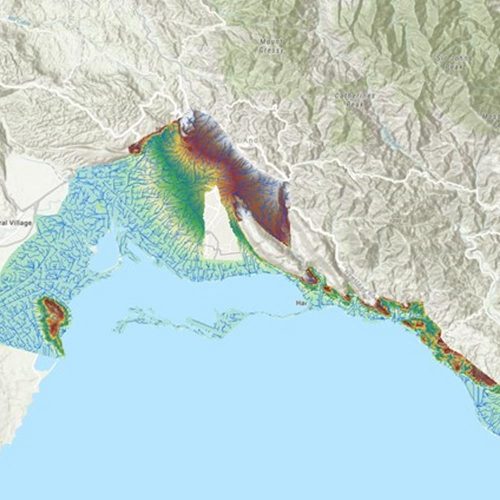
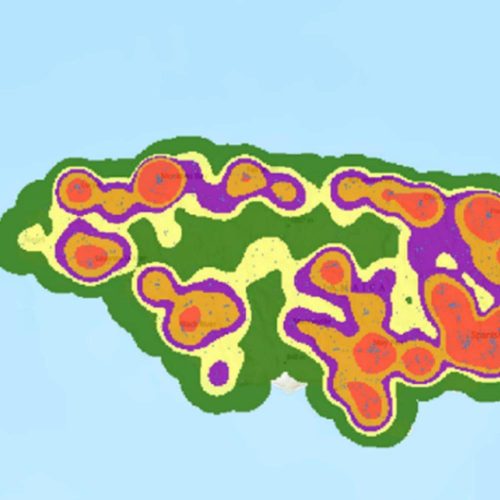
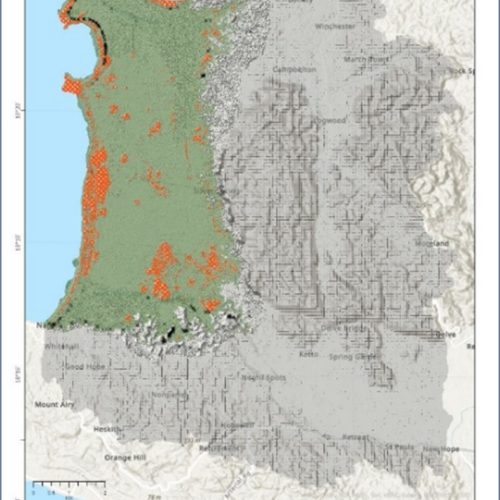
Curious about the actual work that we do? We have completed projects in areas all over the world, from Ireland, to Jamaica, Samoa, the United Kingdom, and Florida. Check out our projects portfolio to learn more about completed works in Síor Consulting, or have a look at our projects gallery below.

GIS Visualisation Of Lava Tube Identification Using Terrain Analysis
GIS visualisation of lava tube identification using terrain analysis

The groundwater resources of Samoa are variable and complex; some recharge and in certain cases even entire rivers, infiltrate rapidly into the ground through lava tubes. The national LiDAR survey enabled rapid identification of lava tube collapses (vertical depressions in the lava fields) using modelling techniques.

GIS visualisation of lava tube identification using terrain analysis

Lake Asbury Dam Crest Profile And Point Of Interest Representative Photos
Lake Asbury Dam Crest Profile and Point of Interest Representative Photos

This figure details a cross-section of the top of dam crest profile and adjacent topography. Also shown are images detailing the dam crest.

Lake Asbury Dam Crest Profile and Point of Interest Representative Photos

Lake Asbury EAP Drawing

Inundation modelling is necessary for the development of EAPs (emergency action plans). The dam break analyses conducted informs what structures and land parcels are under threat of inundation based on each dam break scenario. The EAP drawing details areas under risk of flooding, flood velocities at points of interest and peak stage arrival times from start of rainfall events. All are packaged here in an easy to decipher map that should inform emergency response.

Lake Asbury EAP Drawing

Lake Asbury Drainage Catchment Area

This figure details watershed catchments derived off a Digital Elevation Model (DEM) for the Lake Asbury Dam area. A system of reservoirs feeding into one another, deriving the catchments feeding each separate system was important to inform flood modelling works where designing scenarios where only one dam broke or caused the collapse of a dam further downstream.

Lake Asbury Drainage Catchment Area

Surface Water Management – Conceptual Design
Surface Water Management – Conceptual design

Components of a larger surface water management scheme conceptual design proposed to mitigate impacts related to on-site surface water run-off generated during the temporary works construction period of the HS2 railway. Ponds are strategically placed in each of the water management zones that combined form the temporary works area of the Project. Surface water run-off from the water management zones is stored, managed, and treated in the ponds before discharged at consented locations. The surface water management scheme conceptual designs…

Surface Water Management – Conceptual design

Surface Water Management - Hydrological Analysis For Temporary Culverts
Surface Water Management – Hydrological analysis for temporary culverts

Analysis of runoff routing derived from a 1m resolution Digital Elevation Model (DEM) to identify where major watercourses require protection from turbid water ingress from the Project area. Together with other multidisciplinary analyses that form the approach to surface water management for the Project, these results were a key element to support client applications to the Environmental Agency to successfully obtain surface water consents to enable the construction of temporary roads for HS2.

Surface Water Management – Hydrological analysis for temporary culverts

Micro-catchment ponded areas for 25cm high embankments

Low-lying 25cm to 50cm bunds/embankments were used to pond rainfall run-off to depths favoured by the West Indian Whistling Duck for foraging, and to increase the moisture content more generally. The rainfall ponded areas and depths for the 25cm bunds/embankments are shown in the drawing for the micro-catchments located around the Royal Palm Reserve.

Micro-catchment ponded areas for 25cm high embankments

Natural rainfall storage areas and depth within the Negril Morass

The depressions in the Digital Elevation Model (DEM) would be filled during rainfall events and as such were identified to calculate the existing natural storage within the Morass. This drawing essentially shows the location and depth of water of naturally ponding water in the Morass following heavy and/or prolonged rainfall.

Natural rainfall storage areas and depth within the Negril Morass

Crookstown Cross Property Development – ERT Survey

Geophysical survey of a southern limb of a anticline which marks the northern perimeter of the Bride Valley, Cork. The survey deployed to identify suitable locations for property development based on bedrock integrity and proximity to a GW supply.

Crookstown Cross Property Development – ERT Survey

Crookstown Cross Property Development – Georefernced ERT Surveys

Geophysical survey of a the southern limb of a anticline which marks the northern perimeter of the Bride Valley, Cork. Multiple surveys were deployed to establish the lateral extent of competent bedrock units which would be suitable for property development.

Crookstown Cross Property Development – Georefernced ERT Surveys

Hydrological analysis derived from Digital Terrain Model (DTM)

LiDAR data manipulation in Kingston, Jamaica to showcase hydrological features.

Hydrological analysis derived from Digital Terrain Model (DTM)

Classified hotspot (density) risk modelling of flood events (1962 to 2009) in Jamaica

Case study undertaken to showcase the functionality of the Hotspot risk modelling toolset developed for the Jamaica National Risk Information Platform (NRIP).

Classified hotspot (density) risk modelling of flood events (1962 to 2009) in Jamaica

Morass DEM split into zones of certainty and uncertainty

Review of the Digital Elevation Model (DEM) revealed that certain elevations were in fact vegetation canopy and not ground surface, and consequently the DEM was zoned into areas that were considered ‘reliable’ and those that were considered ‘zones of uncertainty’, within which rainfall-run-off modelling could not be considered to be accurate.

Morass DEM split into zones of certainty and uncertainty

Back To Top