
As a community of environmental, GIS, and computing professionals, all of us at Síor Consulting…
A Multidisciplinary Approach Part 3: Electrical Resistivity Tomography Surveying
Now, it’s time to get a little more personal. If you have been following this multipart series of blogs which describes “A Multidisciplinary Approach”, you will have been eagerly anticipating the release of this next part on Electrical Resistivity Tomography (ERT) Surveying.
The field of geophysics, specifically ERT, is where my love for Geology really grew in college. Having now finished my BSc, I have become passionate about improving my skills and growing my knowledge of ERT and its applications.
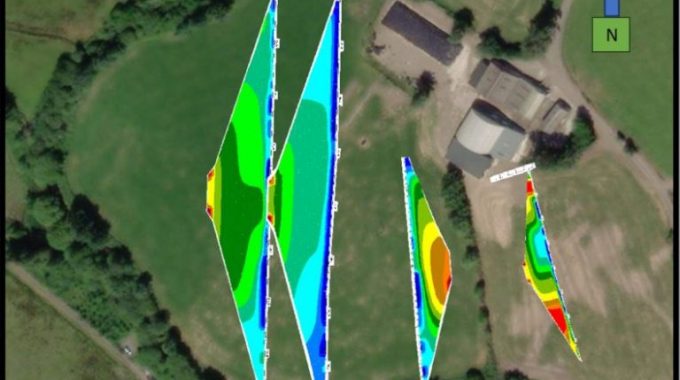
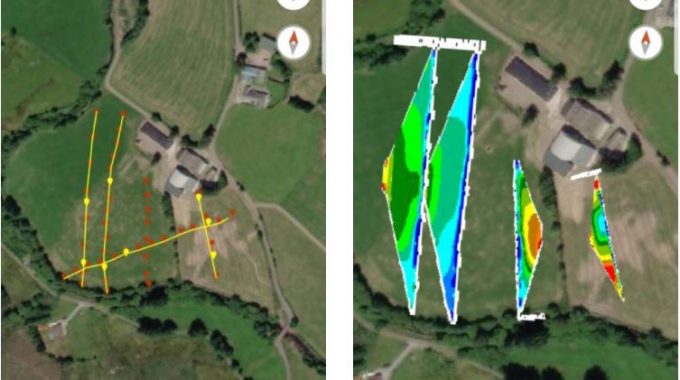
This brings me to one of Síor’s most recent projects which we undertook in collaboration with Southern Pumps (www.southernpumps.ie).The aim of this project was to site a commercial groundwater well for a dairy farm. For this, we deployed ERT surveying to characterise the subsurface of the site, thereby allowing a more informed decision on the well location and required drilling depth. In total, we acquired 5 surveys; of these, 4 surveys were oriented north to south aimed at identifying west to east troughs (see Figure 1). In addition, we conducted 1 survey following a west to east oriented trough (see Figure 2) that had been identified in earlier surveys. Based on the ERT survey results, we decided that the well would be located along the depths of this trough.


I won’t get too deep into the science behind ERT surveying in this blog – that deserves an entire blog series to itself! However, I want to give you an idea of how it works. In a nutshell, the ERT equipment introduces an electrical current into the subsurface at two ground level locations (C1 and C2) via steel ground pegs. This creates a voltage difference that is subsequently measured by two potential electrodes (P1 and P2), located between C1 and C2 at ground level. As you can see in Figure 3,the current electrodes (C1 and C2) are the outermost electrodes while the potential electrodes (P1 and P2) are located in between. This configuration is utilised when a Wenner Alpha electrode layout) array is deployed with all electrodes equidistant from one another. Increasing the spacing between electrodes allows for deeper investigations, while decreasing the spacing returns higher survey resolution.

Resistivity variations observed in profiles typically correlate with (and indicate) variations in lithology, water saturation, fluid conductivity, porosity, and permeability. When ERT data is ground-truthed (by trial pits, boreholes, or outcrop mapping along the survey line), we can use ERT survey results to map stratigraphic units, geological structures, and preferential groundwater pathways.
When undertaking geophysical surveying, it is also important to accurately represent the survey geospatially. If you have been following this blog series, you will probably remember how we at Síor leverage the ArcGIS Collectors App to capture geospatial data in the field. In the case of ERT surveying, we often move the survey equipment onto another location after completing the data collection and before the results are calculated (i.e., inverted). ERT surveying results often include anomalous readings which are re-visited post-survey. The use of the Collectors App allows us to know precisely where any anomalous readings are located geospatially, at any point after the survey has been completed.
I hope you all enjoyed this blog post on ERT surveying as much as I enjoyed writing it. Stay tuned for part 4 of this blog series, which will describe Síor’s approach to hydrogeological investigations and drilling supervision in the context of our multidisciplinary approach.
Related Posts
Comments (0)